GNU gdb is a must have utility to Linux administrators and programmers! Most Linux package, including Redhat Linux, normally includes gdb as part of the standard distribution. Install the gdb package if it is not there.
GNU gdb is a powerful program debugger and core dump analysis tool. Linux administrators appreciated to have this great utility in tracking down Linux core dump and segmentation fault. Linux programmers rely on it to debug various programming bugs! GNU gdb supports diverse programming languages such as C, C++, Objective-C, Fortran, Java, Pascal, assembly, Modula-2, and Ada.- Analysis Linux segmentation fault or core dump file
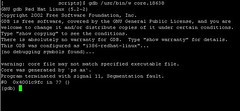
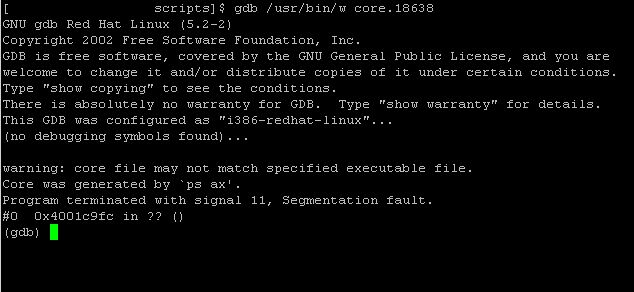
- To analysis Linux core dump file /home/jason/core.18638 with GNU gdb debugger, run command
gdb /usr/bin/w /home/jason/core.18638 - Binary file /usr/bin/w is simply chose. It is because the program which generated this core dump file being unknown in the first place.
- The debugger warns that the specified executable file may not match the core dump file. It suggests that the core dump file was generated by "ps ax" command, where an invalid syntax used to run ps command. The gdb output also can't figure out which line of program code trigger the core dump creation, as shown in the last line, "#0 0x4001c9fc in ?? ()", of the screenshot below.
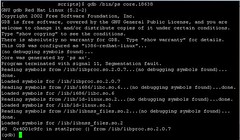
- Rerun gdb again with correct binary by typing
gdb /bin/ps core.18638 - Now, (as shown in screenshot below), gdb load the appropriate symbols to analysis the core dump file. The last line of gdb output, "#0 0x4001c9fc in stat2proc () from /lib/libproc.so.2.0.7", suggests that the core dump generated while executing the stat2proc function in /lib/libproc.so.2.0.7
- Debug an executable C program compiled with debugging information
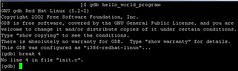
- The C program must be compiled with debugging information that gdb could use. For example, type
gcc -g -o HelloWorld HelloWorld.c
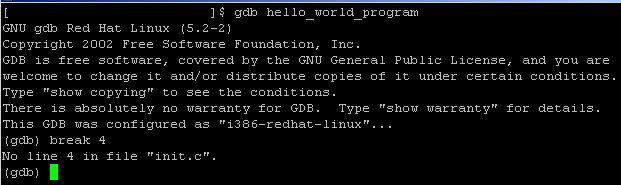
to generate debugging information with -g option of gcc compiler. Gdb will fails to set appropriate breakpoint, as shown in next screenshot, if no debugging information found.
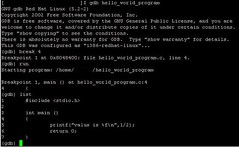
- Run the command
gdb HelloWorld
to debug the program called HelloWorld - Create a breakpoint to tell gdb where to stop the program execution in debugger. Gdb accept breakpoint at line number or function of the corresponding C program source code. For example:
- break 679 would instruct gdb to stop at line 679
- break ComputeMean would instruct gdb to stop right before the breakpoint at ComputeMean function
- Type run to execute the program inside gdb.
The execution will stop right before the breakdown set in previous step or exit on failure. If it fails before the breakpoint, re-examine where suppose to state the break. Repeat the breakpoint step and rerun.
If no failure found, line number of the corresponding source code where the execution stop will be printed in gdb output. Open the source in program editor, normally Vi editor, to locate that line number to re-code (for debugging) if necessary.
Type
run arg1 arg2 < inputfile > outputfile
if needs to run the program with argument. - Type list to list the whole program source code inside the gdb output.
- Type help to get more information on using the gdb command. For example, type help list to get more information on the list command.
- After the program execution stop at breakpoint, type
- next or n to move on to next one line of the program source code.
- step or s to step into a function and execute the function line by line. Command next will not step into function but execute the function as a whole. Type finish to exit from the middle of line execution inside the function.
- Type until 967 to execute continuously until line 967 instead of line execution as with next command.
- Type cont to continuously executing until the end, next breakpoint if more than one breakpoint set, or exit on failure
- Press ENTER (means repeat the last executed command) after pressing next, n, step, or s command to make life easier.
- Type print variable to view the content of variable.
Use the set variable = 32 command to set the new value 32 to variable. - Use the ptype variable to print the variable type.
- Type delete 1 to remove the first breakpoint set.
- Type disable 1 to deactivate the first breakpoint instead of removing.
Type enable 1 again to reactivate the first breakpoint.
Related information:


This article has no comments yet. Why don't write your comments for this article?
So, feel free to write your comments for this article...